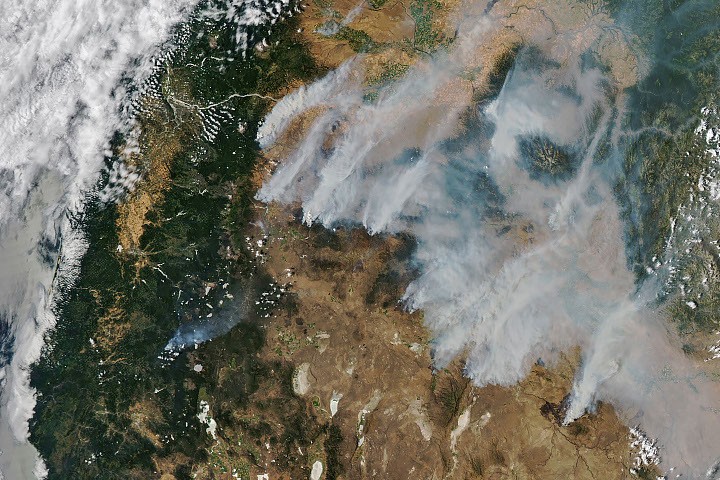
Satellite view captures the scale of Oregon’s fire outbreak
NASA imagery released this week shows smoke pouring across Oregon from dozens of large wildfires, offering a broad, data-driven view of a fire emergency that has already forced evacuations, strained response capacity, and darkened air quality across the region. The image, collected by the MODIS instrument aboard NASA’s Aqua satellite on July 26, depicts smoke drifting northeast from major active fires after lightning storms ignited widespread blazes in central and eastern Oregon earlier in the month.
The agency’s Earth Observatory described a chain of events that will sound familiar in the American West but remains alarming in its speed. Dry thunderstorms crossed the Cascade Range on the evening of July 15, peppering Oregon and Washington with thousands of lightning strikes. By the next day, NASA satellites were already detecting large numbers of wildland fires burning across central and eastern Oregon. What began as many small ignitions intensified as gusty winds pushed flames through landscapes already stressed by extreme drought and summer heat.
The resulting satellite image is more than a dramatic photograph. It is a snapshot of how space-based monitoring systems now function as operational infrastructure during fast-moving disasters, giving emergency agencies and the public a way to track fire growth, smoke spread, and emerging patterns across wide areas that are difficult to observe from the ground.
From lightning strikes to major fire complexes
According to NASA, the largest active fires on the day the image was captured included the Hay Creek Complex, Brewer, Big Grass, Akawa Butte, and Powder River fires. Several were reported at less than 5 percent containment, a sign of how difficult the suppression effort had become. The state also invoked Oregon’s Emergency Conflagration Act to protect communities threatened by fires including the Shingle, Bench, Beachcomb, and Second Flat blazes.
The source text makes clear that this was not an isolated burn scar or a single headline fire. It was a distributed outbreak, with dozens of large fires producing a blanket of haze over eastern Oregon. State officials issued air quality advisories, and many communities faced evacuation orders while more than 10,000 firefighters battled wildfires across the state.
That operational burden matters. When many fires ignite within a short period, agencies are forced to spread crews, aircraft, logistics, and evacuation planning across multiple fronts. Containment percentages can stay low not only because conditions are severe, but because responders are triaging danger across a crowded map rather than concentrating on a single incident.

Why the satellite perspective matters
NASA’s Earth-observing systems are often discussed in scientific terms, but their practical use during wildfire season is immediate. The agency notes that government satellite data are part of a global observation system used to track fire behavior and analyze emerging trends. NASA also pointed to several real-time wildfire monitoring tools it makes available, including FIRMS, the Worldview browser, and the Fire Event Explorer.
These tools matter because wildfire is increasingly a regional systems problem rather than a local line-of-sight emergency. Fire crews need near-real-time information about where heat signatures are appearing, how smoke plumes are moving, and how multiple incidents are interacting across terrain. Public officials need evidence to support air quality warnings and evacuation decisions. Researchers need a record that can later be used to analyze how drought, wind, heat, and ignition timing combined to shape outcomes.
The Oregon image illustrates that value clearly. Ground reports can describe individual communities under threat, but satellite imagery reveals the full geometry of the event: where the fires are clustered, where smoke is traveling, and how large the affected footprint has become. That wider picture is essential when smoke itself becomes a hazard extending far beyond the flames.
Heat, drought, and a million-acre threshold
NASA’s account ties the fire spread to landscapes parched by extreme drought and exposed to summer heat. Those conditions do not ignite fires on their own, but they make it easier for lightning-caused starts to transition into fast-moving incidents. Once wind enters the equation, even initially small fires can escalate quickly.
As of July 27, 2026, news outlets cited by NASA reported that fires in Oregon had burned more than one million acres. The National Interagency Fire Center, meanwhile, reported that fires had burned more than 4 million acres across the United States. Those numbers place the Oregon outbreak within a much larger national fire season, but the state-level figure alone shows why the satellite image has drawn attention. Crossing the million-acre mark is not just a statistic; it is a sign of prolonged ecological stress, sustained emergency operations, and broad social disruption.
The smoke plume seen from space is therefore a downstream effect of several linked systems: a lightning event, dry fuels, extreme heat, drought, and difficult suppression conditions. NASA’s image does not claim to explain all of those forces, but it helps connect them in a way that is immediately legible.

Smoke as a public-health and infrastructure problem
Wildfire coverage often centers on flames, containment, and property damage, but the Oregon case also underscores the significance of smoke. NASA reported that the haze prompted air quality advisories in eastern Oregon. In practice, smoke transforms a fire emergency into a broader public-health event, affecting people far from burn perimeters and complicating daily life even in communities that are not under direct evacuation orders.
Heavy smoke can reduce visibility on roads, limit outdoor work, disrupt recreation and tourism, and create health risks for children, older adults, and people with respiratory conditions. It can also interfere with firefighting itself by making aviation operations more difficult. A satellite image that tracks smoke movement is therefore not only documenting atmospheric conditions; it is helping define the perimeter of disruption.
That wider lens is important for policymakers and emergency planners. A wildfire season should not be measured only by structures lost or acres burned. It should also be measured by how far smoke travels, how long it lingers, and how many communities it affects indirectly.
A space-age tool for a recurring crisis
NASA’s Oregon image is, on one level, a routine product of Earth observation. On another, it is a reminder that satellite infrastructure has become central to climate- and weather-related emergency response. Fires start on the ground, but understanding their full reach increasingly depends on data gathered from orbit.
For Oregon, the immediate message is stark: a burst of mid-July lightning, combined with drought, heat, and wind, escalated into a statewide smoke event and a major firefighting campaign in less than two weeks. For the broader public, the image is a lesson in how modern disaster monitoring works. Satellites do not replace crews on the ground, but they make it possible to see the scope of a crisis before that scope is obvious from any one location.
As wildfire seasons grow harder to manage, that ability to see the whole field may become just as important as the aircraft, engines, and crews deployed within it.
- NASA’s Aqua satellite captured smoke streaming from dozens of Oregon fires on July 26.
- The fires followed thousands of lightning strikes from dry thunderstorms on July 15.
- Officials issued air quality advisories and evacuation orders as more than 10,000 firefighters responded statewide.
This article is based on reporting by science.nasa.gov. Read the original article.

Originally published on science.nasa.gov