An unusually intense storm for mid-April
Super Typhoon Sinlaku drew exceptional attention in the North Pacific this week not only because of its strength, but because of when that strength arrived. According to NASA Earth Observatory, the storm approached the Mariana Islands in mid-April 2026 with sustained winds of around 280 kilometers, or 175 miles, per hour. That places it in the category of a violent typhoon under the Japan Meteorological Agency’s scale, equivalent to a Category 5 storm on the Saffir-Simpson scale.
Intensity of that magnitude is dangerous in any month. In April, it is especially notable. NASA described Sinlaku as one of only a handful of Category 5 typhoons known to have occurred so early in the year. That timing turns the storm from a severe weather event into a reminder of how dynamic and sometimes surprising tropical cyclone behavior can be outside the traditional peak season.
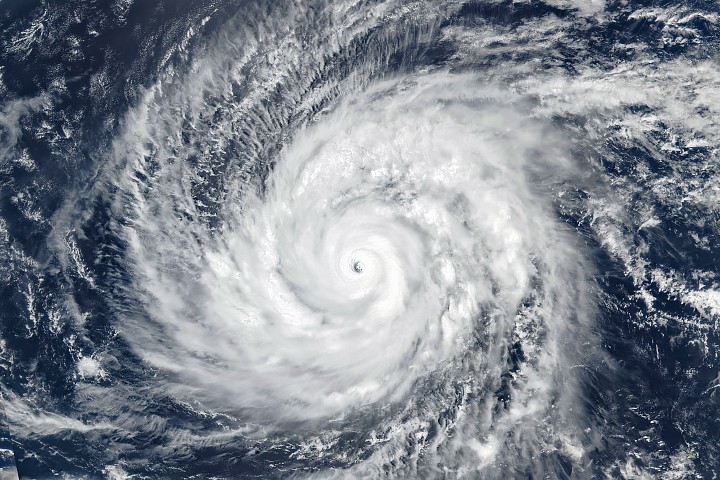
The imagery cited by NASA was captured on April 13, 2026, by the VIIRS instrument aboard the Suomi NPP satellite as the storm spun over the North Pacific and moved toward the islands. By the morning of April 14, Sinlaku was continuing along a northwest track toward the Marianas.
Threats to Guam and the Northern Mariana Islands
The source text says storm bands had already begun bringing heavy rain to Saipan, Tinian, and Rota as of April 14, based on updates from the National Weather Service. Forecasts called for typhoon conditions to affect Saipan and Tinian from April 14 into April 15 before easing to tropical storm conditions.
For communities in the storm’s path, the immediate concern is not the meteorological rarity but the on-the-ground hazard. A storm with winds at Sinlaku’s intensity can produce destructive wind damage, dangerous seas, and prolonged rainfall impacts. The excerpt provided here does not detail evacuation orders, local emergency declarations, or damage reports, so the best-supported conclusion is that authorities were tracking an active threat as the storm closed in on the Mariana Islands.
NASA’s framing underscores how satellite monitoring supports that response. Remote sensing provides a wide-area view of storm structure, movement, and intensity at a time when forecasters and emergency managers need rapid situational awareness.
What satellites saw
The storm was observed by more than one spacecraft and in more than one atmospheric layer. The visible image highlighted by NASA came from VIIRS on Suomi NPP, showing the organized circulation of Sinlaku over the ocean on April 13. The article also notes a second striking observation: the VIIRS instrument on NOAA-20 captured nighttime imagery of concentric gravity waves made visible in the mesosphere by airglow.
That detail matters because it illustrates how a powerful storm in the troposphere, the lowest layer of the atmosphere where weather occurs, can generate detectable effects higher above. NASA specifically notes that although Sinlaku itself existed in the troposphere, it formed gravity waves visible much higher up. The result is a layered picture of the storm, with direct weather impacts near the surface and atmospheric signatures extending well beyond the cloud tops visible in standard storm imagery.
For Earth observation, this is the kind of event that demonstrates the value of continuous multisatellite monitoring. Operational forecasting depends on tracking the storm itself, but scientific observation can also capture secondary atmospheric effects that deepen understanding of how extreme systems interact with the broader atmosphere.
Why Sinlaku stands out in 2026
NASA says Sinlaku is the second Category 5 tropical cyclone of 2026, following Horacio in the South Indian Ocean in late February. Even without broader seasonal data in the supplied excerpt, that detail places Sinlaku within a year that has already seen at least one other top-tier storm in another basin.
The more striking point, though, is basin-specific timing. Northwestern Pacific typhoons can occur year-round, but the most intense storms are less common this early. NASA’s wording is careful: Sinlaku is described as one of only a handful known to have reached Category 5 intensity so early in the year. That does not mean unprecedented, and it does not by itself establish a climate trend. It does support the narrower conclusion that Sinlaku belongs to a rare subset of very early high-intensity typhoons.
That distinction is important in responsible coverage of extreme weather. The source material supports a strong claim about rarity and timing, but not a causal claim about why this particular storm intensified when it did. The story here is the intensity, the timing, the track toward U.S. Pacific territories, and the unusually vivid satellite observations that accompanied it.
Earth observation as public infrastructure
NASA published Sinlaku as an Earth Observatory image of the day, and the entry functions as more than a visual feature. It is also an example of how publicly available satellite imagery can bridge science communication and operational awareness. The article identifies the instrument, the date and approximate time of acquisition, the storm’s wind speed, the forecast window for typhoon conditions, and the atmospheric phenomena visible around the system.
That combination makes the piece useful beyond specialist audiences. It gives the public a way to understand what forecasters mean when they describe a storm as violent or Category 5-equivalent, and it shows how space-based observation translates into a better picture of rapidly evolving events over remote ocean regions.
For islands spread across the Pacific, that capability is not abstract. Satellite imagery helps fill observational gaps where surface networks are limited by geography. It also provides a shared visual language for communicating urgency.
The bottom line
Super Typhoon Sinlaku is significant because it combined extreme strength with unusually early timing. As it approached the Mariana Islands in mid-April 2026, the storm carried sustained winds of roughly 280 kilometers per hour, enough to qualify as a violent typhoon and the equivalent of a Category 5 hurricane. NASA says that makes it one of only a handful of typhoons known to have reached that level so early in the year.
With heavy rain already reaching Saipan, Tinian, and Rota and forecasts calling for typhoon conditions through April 15, the event is both a serious regional weather threat and a notable observation case. Sinlaku’s structure was captured by VIIRS on Suomi NPP, while a separate NOAA-20 image showed gravity waves high in the atmosphere generated by the storm below. Together, those views make Sinlaku one of the clearest examples this year of how Earth observation can document a rare and dangerous storm in near real time.
This article is based on reporting by science.nasa.gov. Read the original article.
Originally published on science.nasa.gov