A short-lived burst of color from orbit
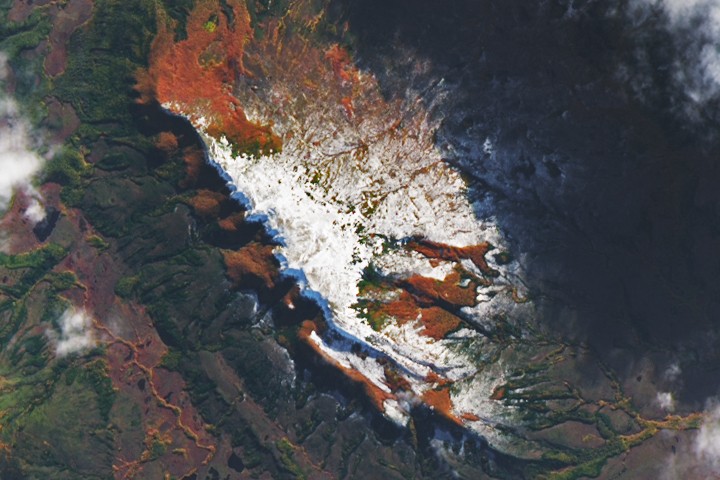
NASA’s Earth Observatory has published a new satellite view of southern Chile that captures one of Patagonia’s quieter seasonal transformations: the brief autumn color change in the region’s deciduous beech forests. The image, acquired on April 12, 2026 by the Operational Land Imager aboard Landsat 9, shows reddish hillsides in the Magallanes region after a break in persistent cloud cover opened a clear view from space.
The scene is striking because Patagonia is usually associated with a different palette. Snow-covered peaks, dry brown plains, and bright glacial lakes dominate most images of the far south. For a short period in the austral autumn, however, temperate forests add yellows, oranges, and reds to the landscape. NASA’s release turns that moment into a useful ecological snapshot as well as an arresting image.
The southernmost temperate forests on Earth
The forests in this part of Chile are not just visually distinctive. NASA notes that Patagonia contains the southernmost temperate forests in the world, and many of the species found there occur nowhere else. Among the most important are trees in the southern beech genus, Nothofagus, which form the structural basis of Andean forest ecosystems.
These trees are notable for their adaptability. According to the source text, southern beeches can tolerate freezing temperatures and conditions approaching desert-level dryness. That resilience helps explain their broad distribution across southern South America and their role in landscapes that shift dramatically across latitude and elevation.
In autumn, the deciduous varieties put on the display seen in the new Landsat image. As days become shorter and colder, their leaves turn shades of yellow and red, briefly remapping the mountain slopes in warmer tones before winter settles in.

Lenga beech defines the scene
The article places particular focus on the lenga beech, or Nothofagus pumilio. This species ranges from roughly 36 degrees south latitude to Tierra del Fuego at around 55 degrees south, stretching about 2,000 kilometers along the continent’s spine. That makes it one of the defining trees of southern Andean environments.
Where lenga grows, it often dominates the forest. Researchers cited by NASA describe places where it is the predominant or even the only tree species present. Its preferred habitat is subalpine, and its distribution often marks the upper boundary of where trees can grow in a given area.
That elevational role gives the species extra significance in satellite imagery. When red-orange tones appear high on the slopes, they are not just an aesthetic feature. They also indicate where this cold-tolerant forest type reaches into the harsher transition zone below snow and above lower valleys.
Latitude changes where the forest can live
One of the more interesting details in NASA’s summary is how the elevation of lenga forests changes across the species’ long north-south range. In the warmer northern part of its distribution, lenga occurs at higher elevations, around 1,700 meters above sea level. Farther south, where the climate is cooler overall, the species can thrive much lower.
That pattern helps explain the Magallanes image. The red ridgetops shown in the scene, about 100 kilometers northwest of Punta Arenas, stand at roughly 600 meters above sea level. In a warmer region, that same ecological niche might be found much higher in the mountains. In southern Patagonia, the climate brings the subalpine character of these forests closer to sea level.
This kind of geographic compression is one reason Patagonia is so important to Earth observation. Environmental boundaries that would be spread across large elevational ranges elsewhere can appear over comparatively modest height differences, making them easier to map and compare over time.
Why a satellite image matters
At one level, the release is an image-of-the-day feature meant to showcase a beautiful landscape. But the underlying value of the observation is broader. Seasonal imagery from instruments like Landsat 9 helps scientists and the public track vegetation patterns, understand species distributions, and observe how land cover changes through time.
Cloud-free imagery is especially useful in southern Chile, where weather often limits visibility. A single clear pass can reveal topography, snow cover, forest extent, and seasonal color in a way that ground observations alone cannot. The April 12 image does exactly that, combining a weather break with a seasonal moment that does not last long.
NASA’s account also underscores how remote sensing can make ecological details legible at regional scale. What might appear from the ground as isolated patches of color becomes, from orbit, a continuous band of vegetation across mountainsides. That wider perspective is essential for understanding how forests occupy terrain and respond to climate conditions.
A vivid scene with scientific context
The Magallanes image works because it joins visual drama with ecological specificity. The reds are not random; they are tied to a known seasonal process in a known forest type. The forest type is not generic; it is linked to southern beeches, and especially lenga. And the location is not just “Patagonia” in the broad tourist sense, but a mapped section of southern Chile where elevation, latitude, and climate intersect in a distinctive way.
That combination is what makes NASA’s release more than a scenic dispatch. It documents a brief seasonal event in one of the planet’s most unusual forest regions, using a satellite platform designed to observe Earth systematically over time. The resulting image captures a fleeting stage in the annual cycle of southern Patagonia, while also reminding viewers that even the most remote landscapes can be read closely from orbit.
For readers outside the region, the image offers a useful correction to the common perception of Patagonia as only rock, ice, and wind. For a few weeks each year, the forests blaze as well.
This article is based on reporting by science.nasa.gov. Read the original article.
Originally published on science.nasa.gov