Improved hurricane forecast graphics can help people identify some threatened inland areas, but that clearer recognition does not necessarily make them feel more at risk or more likely to prepare, according to research from Florida State University.
The study examined a revised National Hurricane Center forecast graphic that expands the familiar hurricane forecast cone to include tropical-storm and hurricane watches and warnings for inland areas. Its findings highlight a persistent communication challenge: accurately displaying a threat and motivating an appropriate response are not the same task.
A clearer view of inland watches
Hurricane graphics have long centered public attention on the forecast cone, which can place visual emphasis on the coast even though dangerous conditions may extend well inland. The updated format was developed by the National Hurricane Center in 2024 to show watches and warnings beyond the traditional cone more explicitly.
Florida State researchers tested whether that change improved how people understood hurricane threats. They found a mixed result. Participants without specialized weather knowledge were better able to recognize inland areas that were under hurricane or tropical-storm watches when shown the revised graphic.
That is an important improvement in a country where storm hazards are not confined to shorelines. A map that makes inland watch areas easier to identify can close one basic gap in the interpretation of official information.

Recognition did not translate into action
But the study found no significant increase in how dangerous participants believed the storms were, nor in their stated intention to take protective measures. In other words, the enhanced graphic improved recognition of certain watch areas without producing a measurable shift in perceived personal danger or planned preparation.
Participants also did not improve in identifying areas under storm warnings. The distinction is consequential because watches and warnings communicate different levels of urgency, and public understanding of both is central to a useful alerting system.
Lead author Elizabeth Ray, an assistant professor at Florida State University, said the researchers wanted to test whether the communication changes were actually helping people understand the risk they faced. The answer is not a simple success or failure: the design appears to help with one aspect of comprehension while leaving other, safety-critical outcomes unchanged.
The cone misunderstanding persists
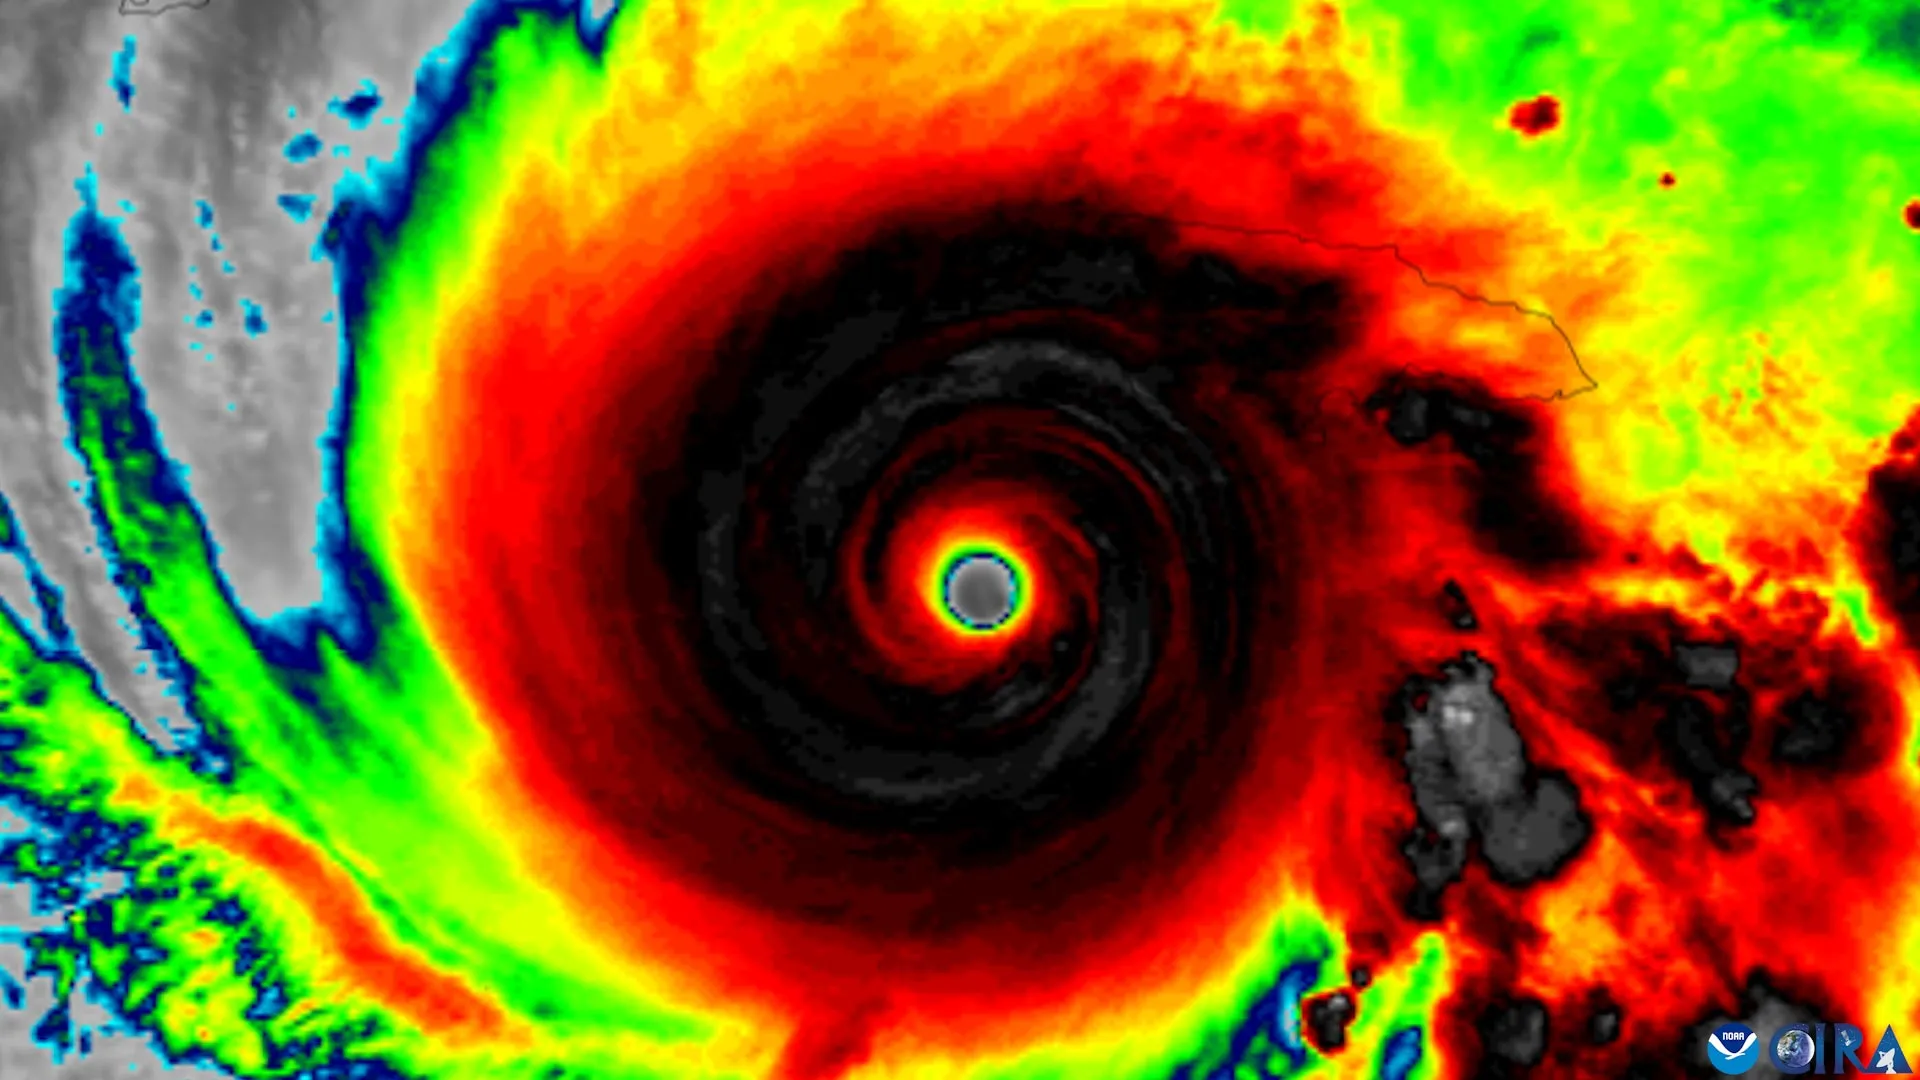
The research also identified a continuing misunderstanding of the hurricane cone. The cone is widely used as a focal point in hurricane coverage and public messaging, yet the study indicates that confusion about what it represents remains a potentially dangerous issue.
That matters because the cone is not a complete depiction of all storm impacts. The revised graphic was intended to broaden the presentation of watches and warnings, including those affecting inland communities. Even with that additional information, however, the researchers did not observe stronger perceptions of danger or greater intent to act.
The gap suggests that warning communication cannot rely only on adding or refining map elements. A graphic may answer the question of where an official alert applies while still failing to answer the question a resident needs to resolve: what does this mean for me, and what should I do now?

From forecast accuracy to public preparedness
The study was published in the American Meteorological Society journal Weather, Climate, and Society. It evaluated an experimental version of the updated graphic and focused on public interpretation rather than on the meteorological performance of the forecasts themselves.
Its central result is a reminder that risk communication involves several steps. People must first notice and correctly identify the area facing a threat. They must then understand the seriousness of that threat, connect it to their own circumstances and decide whether protective action is needed. Progress at the first stage does not guarantee progress at the later ones.
For forecasters and emergency communicators, that means map design is only one part of preparedness. The study does not argue against the revised graphic; it found a real benefit in recognition of inland watch areas. Instead, it points to the need for communication that also makes urgency and recommended behavior understandable.
A design problem with real-world stakes
Hurricane information must often reach people quickly, under stressful conditions and through many channels. A forecast map needs to be technically accurate, visually legible and meaningful to people who may have little specialized weather knowledge. The Florida State findings show how difficult it is to meet all of those goals at once.
- The revised forecast graphic helped participants identify inland areas under watches.
- It did not significantly increase perceived danger or intended protective action.
- Participants showed no improvement in identifying areas under storm warnings.
- Misunderstanding of the hurricane cone remained a concern.
As the National Hurricane Center and other agencies continue refining public-facing products, the study offers a practical caution. Better depiction of an alert is valuable, but it is not by itself proof that audiences understand the hazard or will respond. The most effective warning systems will need to bridge both parts of that gap.
This article is based on reporting by Science Daily. Read the original article.

Originally published on sciencedaily.com