Why CPU Temperature Is Worth Paying Attention To
Every processor converts electricity into computation, and heat is an unavoidable byproduct of that work. The harder a chip is pushed, whether by a demanding game, a video export, a long software build, or simply dozens of browser tabs competing for the same resources, the more heat it produces. Cooling hardware exists to carry that heat away from the silicon and out into the room, and when it keeps up, the system behaves exactly as intended.
When cooling falls behind, the consequences stretch from annoying to serious. A chip that gets too warm will typically reduce its own clock speeds to protect itself, which shows up as stuttering, dropped frames, or sluggish performance. In more extreme cases a machine may shut down or reboot without warning. That is why a temperature reading is one of the most useful single diagnostics available on a modern computer: it offers a direct look at whether the cooling system is doing its job.
Engadget's guide to the topic makes a reassuring point for anyone who is not a hardware enthusiast. There is solid free software that can help you keep tabs on your computer's health, so the barrier to entry is essentially zero. You do not need a specialized diagnostic rig or a paid service to find out how warm your processor is running.
What a CPU Temperature Reading Actually Tells You
Modern processors include thermal sensors built directly into the chip. Monitoring software reads those sensors and reports a number, usually in degrees Celsius, along with a range of related data such as fan speeds and the temperatures of other components. The raw figure is simple, but interpreting it well requires a little context.
Idle temperatures versus load temperatures
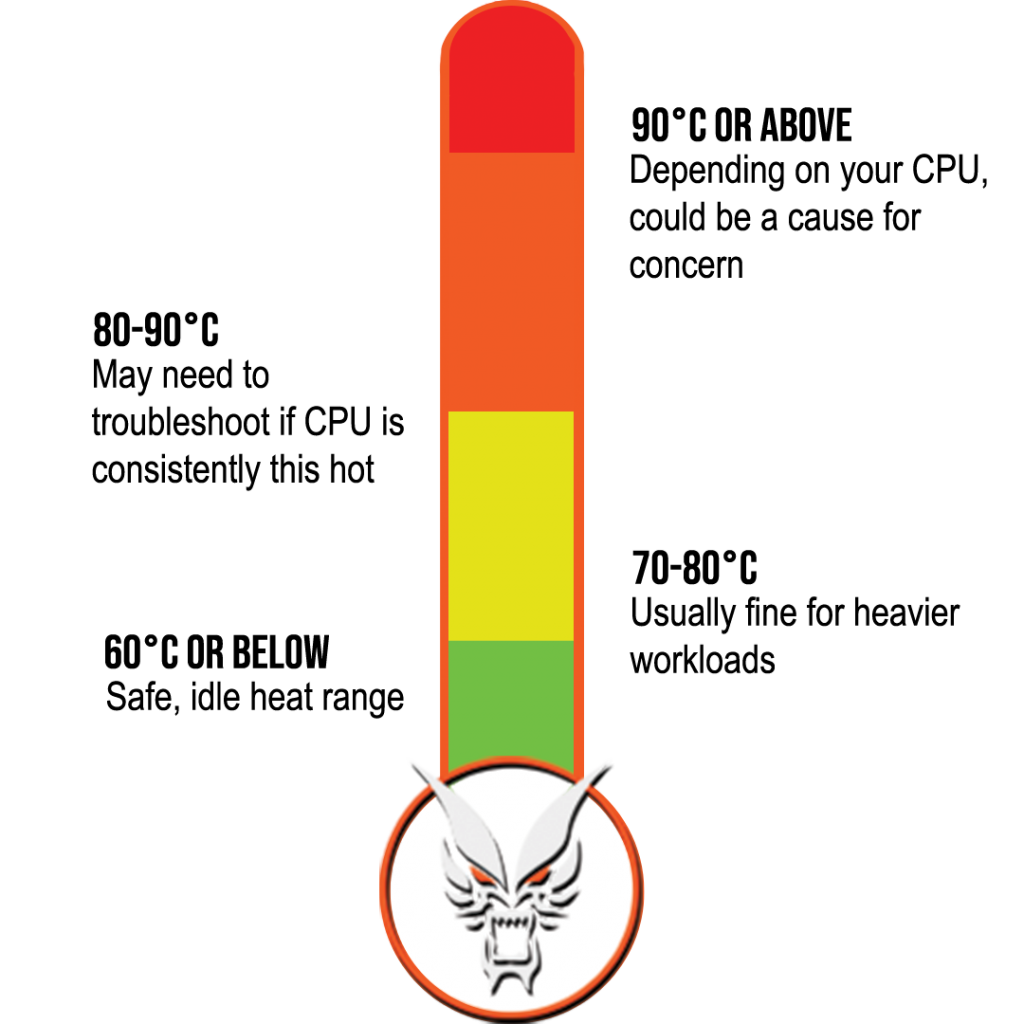
A processor sitting at the desktop with nothing demanding running will generally report a much lower temperature than the same processor in the middle of a heavy workload. Both numbers are useful, but they answer different questions. Idle readings hint at how well the baseline cooling setup works and how warm the surrounding environment is, while load readings show what happens when the chip is genuinely stressed. Comparing your own idle and load numbers gives you a personal reference point that no generic chart can replace.
Why one number is never the whole story
The same temperature can mean different things in different machines. A laptop with a thin chassis and a single fan has far less room to dissipate heat than a desktop tower with multiple case fans. Room temperature also matters enormously, since a system running in a warm room starts from a higher floor. Sensor placement, the age of the hardware, and the specific workload all shape the reading. The goal is not to match someone else's numbers but to understand your own machine's normal behavior and spot changes.

How to Get Started With Free Monitoring Software
Checking your processor temperature does not require any special equipment. The sensors are already there, and the tools that read them are widely available at no cost.
Dedicated monitoring utilities
Free monitoring applications are the most flexible option. They typically display current temperatures in real time, keep track of minimum and maximum values, and can log readings over long periods. Many also report fan speeds and the temperatures of graphics cards, storage drives, and motherboards, which helps you see whether a heat problem is isolated to the processor or affects the whole system. Some can be configured to warn you when a reading crosses a threshold you set yourself.
Manufacturer tools and built-in options
Some computer makers ship their own utilities that expose thermal data, often alongside fan control settings. Operating systems may also surface basic hardware information without any third-party software at all. These options tend to be less detailed than dedicated monitoring tools, but they are a reasonable starting point if you would rather not install anything extra.
The readout in your firmware
Another approach costs nothing and requires no downloads at all: the setup screen built into your computer's firmware. Accessible during startup, it usually shows a live temperature reading for the processor. It will not track trends over time, but it is a quick way to confirm that the sensors are working and that the machine is not running hot before the operating system even loads.
How to Interpret What You See
- Establish a baseline. Record what your system reads when it is sitting idle and when it is under a normal workload, so you have something to compare against later.
- Compare like with like. A reading taken five minutes after startup is not comparable to one taken during an intensive task. Note the conditions along with the number.
- Watch for trends, not snapshots. A temperature that slowly climbs over weeks or months often points to a physical cause such as dust buildup rather than a sudden failure.
- Check the rest of the system. If the processor is hot but everything else looks normal, cooling for that component is the likely culprit. If several sensors are elevated, the problem may be airflow or ambient heat.
- Listen as well as look. Fans that run at maximum speed constantly are a signal in themselves, even before you read a single number.

Common Reasons CPU Temperatures Creep Up
- Dust accumulation. Layers of dust on heatsinks, fan blades, and intake vents act as insulation and reduce how much air the cooling system can move.
- Obstructed airflow. Laptops used on beds, sofas, or carpet can block their own intake, and desktops tucked into enclosed cabinets can trap warm air around the case.
- A warmer room. Cooling works by moving heat into the surrounding air, so a hot room raises the floor that every component starts from.
- Aged thermal interface material. Over years of use, the material between the processor and its heatsink can lose effectiveness.
- Failing fans. A fan that has slowed, stalled, or become noisy no longer moves the air it once did.
- Sustained heavy workloads. Long gaming sessions, renders, or simulations simply produce more heat than light everyday use.
- Aggressive performance settings. Overclocking and power profiles that favor maximum speed over efficiency raise heat output as a trade-off.
Warning Signs Worth Taking Seriously
Certain symptoms deserve prompt attention rather than a shrug. If your fans are constantly at full tilt during light tasks, if performance drops noticeably after a few minutes of work, if the machine shuts down or restarts under load, or if ventilation feels hot to the touch, those are all indications that the cooling system is struggling. Persistent high readings that were not present before are the clearest signal of all, because they represent a change in a system that previously worked fine.

A Simple Habit That Protects Your Hardware
You do not need to watch temperatures every day. Checking them periodically, and again whenever you notice unusual fan noise or slowdowns, is enough to catch most problems early. Keep vents clear, use laptops on hard flat surfaces, give desktops room to breathe, and clean out dust when it builds up. Because the software is free and the sensors are already in place, the only real investment is a few minutes of attention.
The Bottom Line
Monitoring your processor's temperature is one of the simplest and most effective ways to keep tabs on your computer's health. Free software makes the readings easy to see, and understanding whether your machine runs cool at rest and stays reasonable under strain turns a vague worry into a concrete observation. That awareness is what allows you to act before a minor cooling issue becomes a repair bill.
This article is based on reporting by Engadget. Read the original article.
Originally published on engadget.com