A public satellite tool gets a practical upgrade
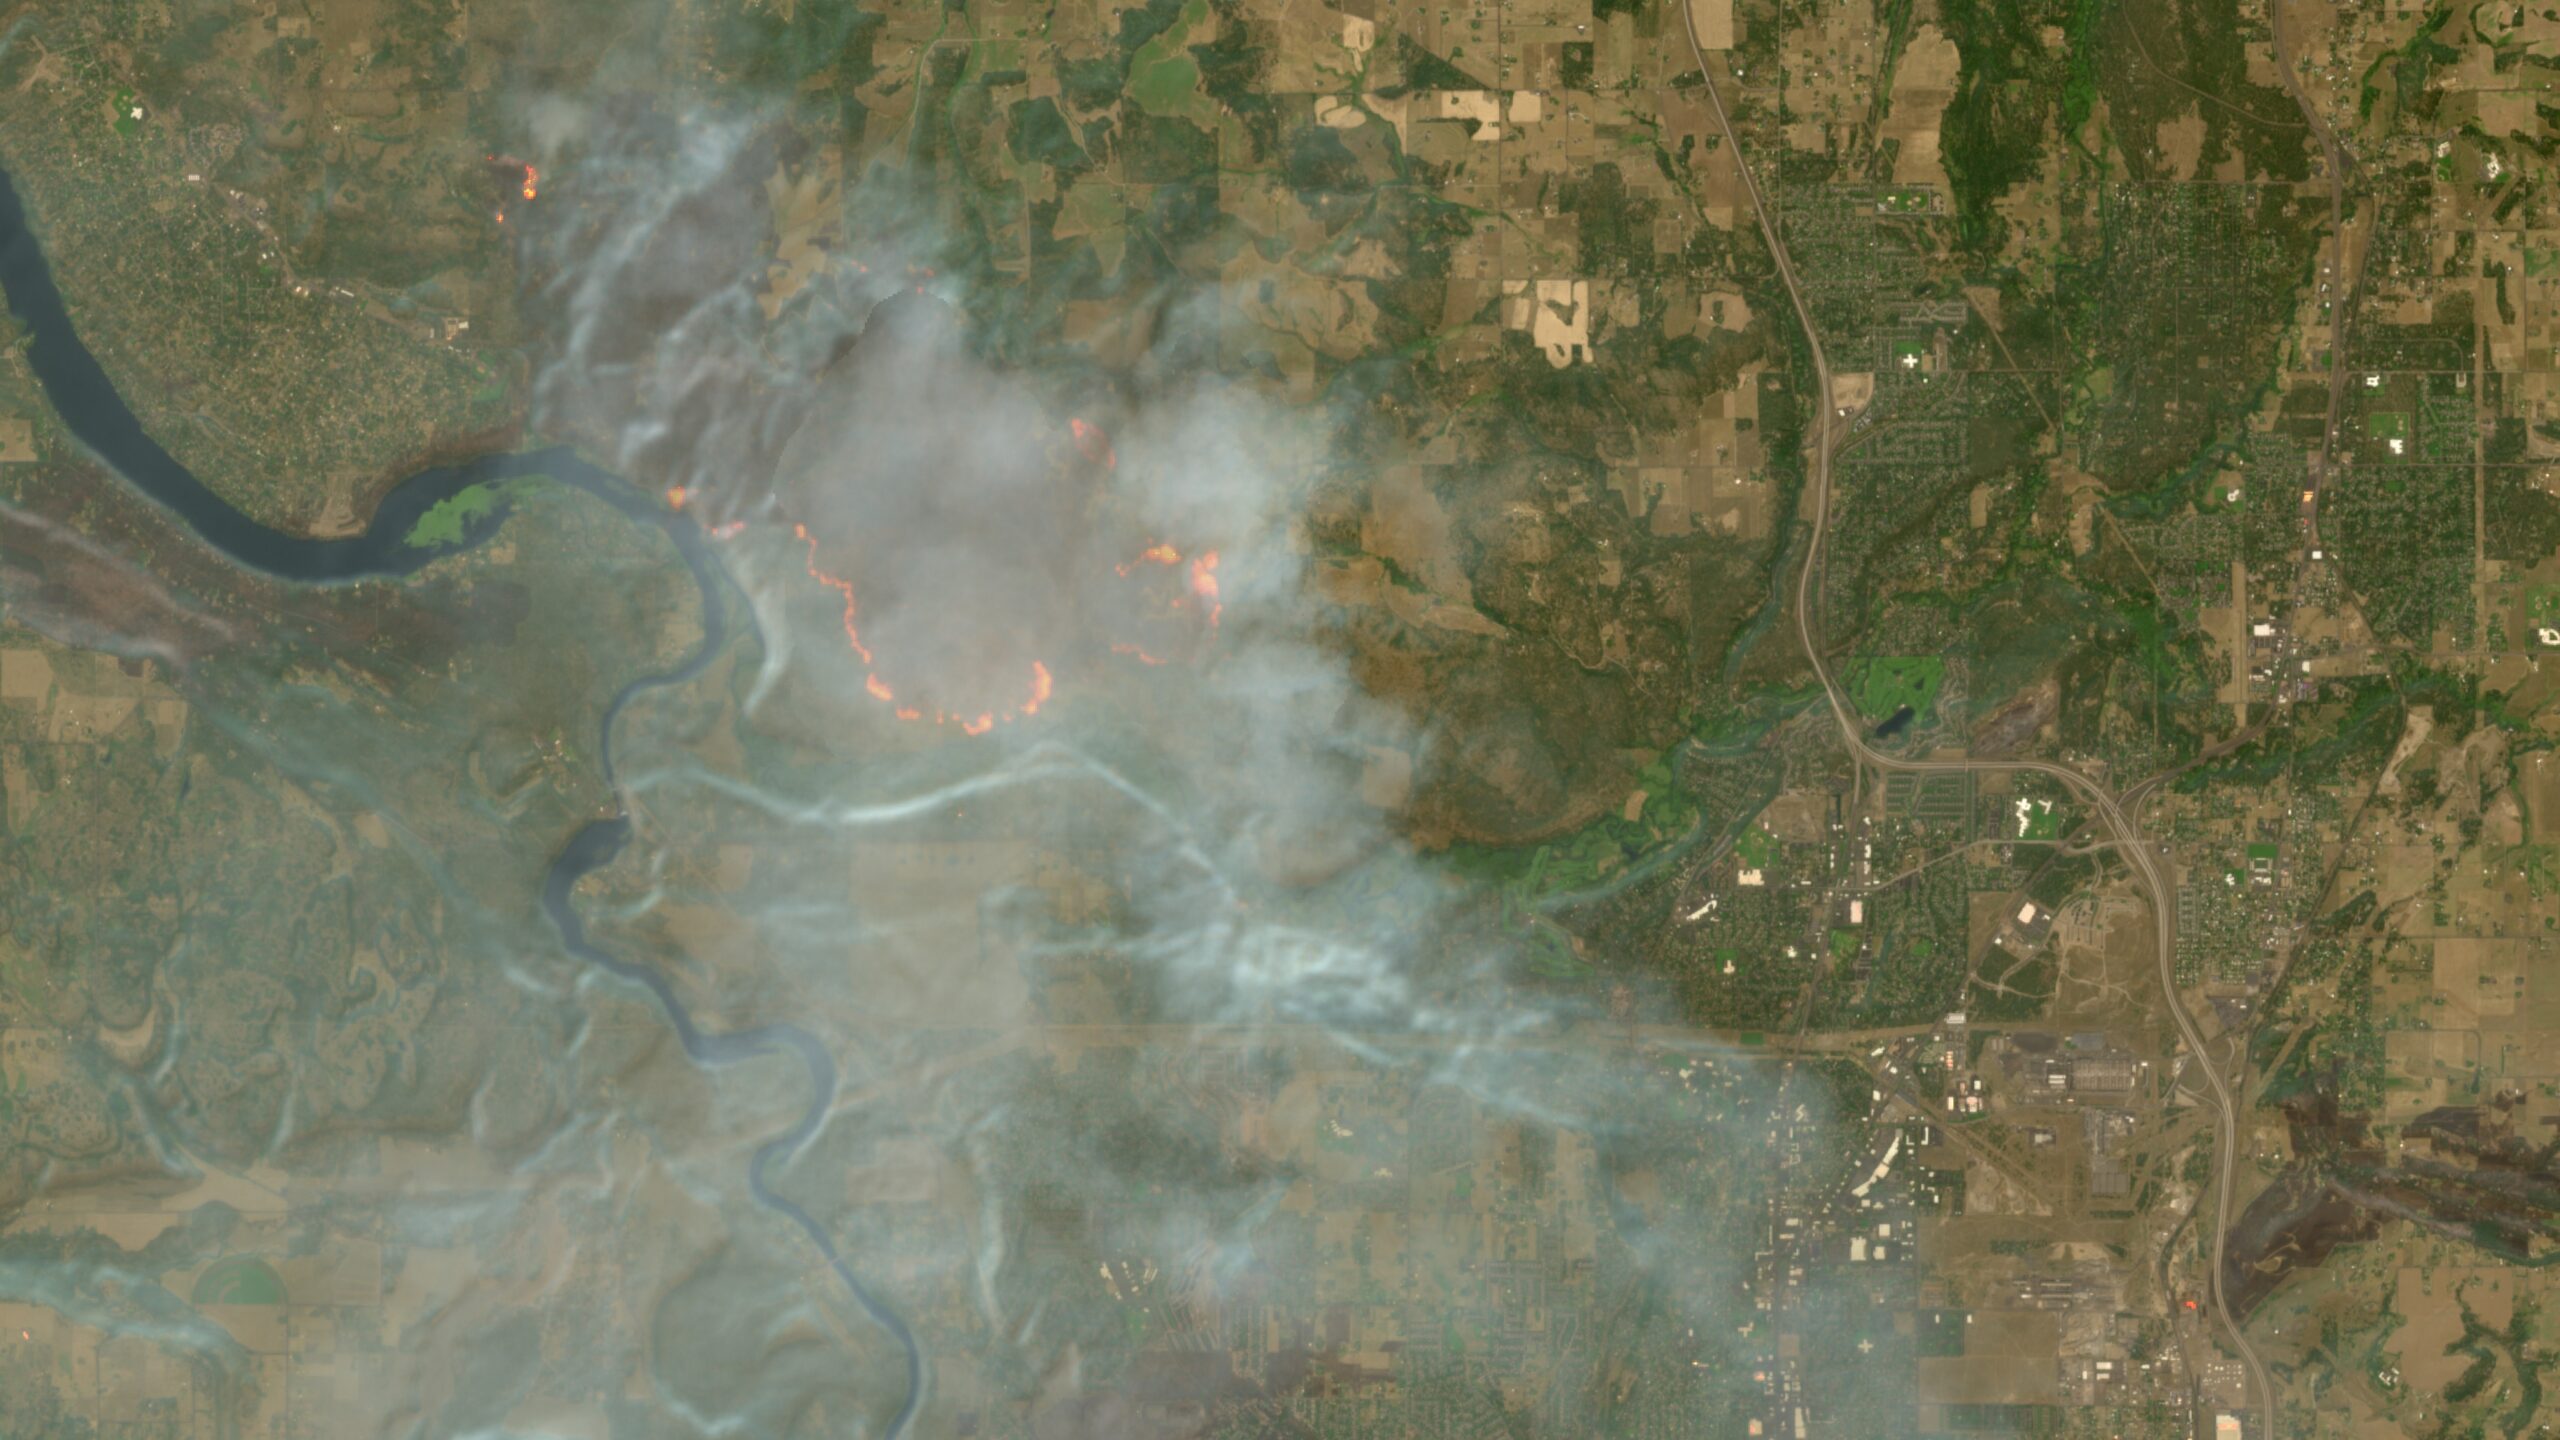
Europe’s free Copernicus Browser has added a dedicated wildfire visualization layer for Sentinel-2 imagery, a change that makes one of the world’s most accessible Earth observation services more immediately useful during an intense global fire season. The update went live on August 4, according to the supplied source text, and gives users a one-click view designed specifically to reveal active fires, burning vegetation, and burn scars.
That may sound like a small interface change, but it matters because the Copernicus Browser is already a widely available gateway to recent satellite imagery. Instead of requiring users to understand band combinations or manually load a custom script, the new layer turns wildfire monitoring into a simpler public workflow. For journalists, researchers, emergency observers, and ordinary residents trying to understand a fire near them, that lowers the barrier to using satellite data in real time.
The service draws on imagery from the European Space Agency’s Sentinel satellites as part of the European Union’s Copernicus Earth observation program. In the case of wildfire tracking, Sentinel-2 is especially important because its multispectral images can capture visible and infrared information at resolutions down to 10 meters in some bands. That combination allows fire-related changes on the ground to stand out in ways that ordinary natural-color imagery often cannot.
Why the new layer matters
Before this update, Copernicus Browser offered default visualization modes built from different spectral band combinations, but users who wanted a more tailored wildfire view had to add it themselves through the platform’s custom visualization option. The newly integrated default layer changes that. A capability that previously depended on technical familiarity is now built directly into the standard experience.
According to the source text, the wildfire visualization shows active fires in white or yellow, burning vegetation in red, and burned landscapes in dark brown or black. Those visual cues matter because fire scenes are complex. Smoke can obscure flame fronts, recently burned land can blend into surrounding terrain in standard imagery, and users unfamiliar with infrared composites can struggle to interpret what they are seeing. A tuned wildfire layer compresses that complexity into a clearer operational picture.
In practical terms, the update helps users answer straightforward questions faster: Where is the active fire edge? Which areas appear newly burned? How far has smoke spread relative to the visible fire zone? Those are not the same as formal emergency response products, but they are useful questions, and the answer no longer requires copying code into a browser tool.
From expert script to default feature
The added layer originated as a JavaScript visualization script written by remote sensing expert Pierre Markuse. The source text says the script combines the red visible-light band, the narrow near-infrared band, and the short-wave infrared 2 band. Together, those inputs help separate healthy vegetation, active burning, and burned terrain by emphasizing differences in plant condition, heat-related effects, and moisture signals in the landscape.
That lineage is notable. Instead of introducing an entirely new sensor or launching a new mission, the improvement comes from packaging existing satellite capabilities in a form that is easier to use. It is a reminder that meaningful advances in public technology sometimes come from interface design and workflow integration rather than hardware alone.
The source text also credits Simon Proud, a mission scientist for Sentinel-2 at the European Space Agency, with pushing to have the script added as a default option inside Copernicus Browser. That institutional step matters because it converts an ad hoc community practice into an officially surfaced feature. Once a tool becomes native to a platform, it is more likely to be discovered, reused, and trusted by a much broader audience.
Part of a larger wildfire data ecosystem
The Copernicus update does not stand alone. The source text notes that other systems already support fire and smoke monitoring, including NASA’s FIRMS platform, which provides access to a global map of fires detected by NASA satellite sensors. That broader context is important because wildfire intelligence is increasingly built from overlapping constellations, agencies, and public interfaces rather than any single source.
What makes the Copernicus Browser addition stand out is not that it is the only fire-monitoring tool, but that it extends a free and open imagery service already used for many kinds of Earth observation. A built-in wildfire mode means users do not have to move to a specialized fire platform to get a more interpretable view from Sentinel-2 scenes. That improves continuity between general-purpose imagery browsing and event-specific monitoring.
The timing also matters. The source text frames the launch against a record wildfire season, which makes usability enhancements more consequential than they might seem in quieter periods. During active fire outbreaks, even incremental reductions in friction can expand who can inspect imagery and how quickly they can do it.

What this signals
This is a modest but meaningful example of how public digital infrastructure evolves. The underlying satellite system did not change on August 4. What changed was the ease with which a public user could convert raw multispectral imagery into a fire-focused interpretation. In an era of climate-linked hazards, that shift has wider implications.
It suggests that open Earth observation programs are moving beyond simply publishing data and toward shaping more usable analytical experiences. When governments and agencies make interpretation layers easier to access, they are effectively broadening participation in environmental monitoring. That can support better public understanding, faster media verification, and more informed civic discussion during disasters.
There are limits, of course. A visualization layer is not a substitute for emergency management guidance, and satellite images have timing, cloud, and resolution constraints. But as a public-facing upgrade, the new Copernicus wildfire view makes an already important service more actionable. In wildfire monitoring, clarity is not cosmetic. It is part of the utility.
This article is based on reporting by Ars Technica. Read the original article.
Originally published on arstechnica.com