Nighttime Light Is Becoming a More Powerful Measure of Economic and Energy Change
New maps built from NASA satellite imagery are showing a world in which the night is changing faster than many assumptions about development, energy use, and instability would suggest. Using nighttime observations collected over nearly a decade, scientists produced a global analysis that tracked where artificial light brightened, dimmed, or fluctuated between 2014 and 2022. The resulting picture is not just visually striking. It offers a new way to detect industrial activity, infrastructure expansion, and shifts in how people use energy.
NASA described the findings as a challenge to older expectations about the night. Rather than a simple story of steadily increasing illumination, the maps reveal an uneven and dynamic landscape. Some places grew brighter because of electrification and development. Others dimmed because of energy conservation or changing economic conditions. In still other regions, both trends appeared together over time.
A data set built from more than a million nightly images
The scale of the analysis helps explain its significance. The study team, led by Tian Li and Zhe Zhu at the University of Connecticut, used a new algorithm to analyze roughly 1.16 million satellite images captured every night for nine years by the Visible Infrared Imaging Radiometer Suite, or VIIRS. NASA said the underlying imagery was collected around 1:30 a.m. local time each day and covered most of the inhabited world, between 60 degrees south and 70 degrees north.
The sensors involved are capable of resolving light sources down to the scale of a toll booth on a dark highway while orbiting Earth at more than 16,000 miles per hour. They fly on Earth science satellites launched and operated by NASA and the National Oceanic and Atmospheric Administration. The study itself was reported on April 8 in Nature.
That combination of long duration, global reach, and fine enough resolution makes the product especially useful for tracking patterns that can be hard to observe consistently from the ground. Nighttime light has long been used as a proxy for development and economic activity. This work pushes that concept further by focusing not only on brightness levels but on how and where lights change over time.
Energy extraction leaves a visible signature
One of the clearest findings involves the U.S. oil and gas sector. During the period studied, domestic production of oil and natural gas reached record levels, driven by technology gains and horizontal drilling. Satellite imagery captured cycles of intense gas flaring over central U.S. regions, especially in Texas’s Permian Basin and North Dakota’s Bakken Formation.
Flaring happens at oil wellheads when excess gas, mostly methane, is burned off. NASA notes that the process releases carbon dioxide and soot among other byproducts. Deborah Gordon of the Rocky Mountain Institute, who was not involved in the study, summarized the waste bluntly: flared gas is money burned.
That framing helps explain why the night-light data matters beyond academic interest. Illumination patterns can reveal not only where energy activity is expanding, but where inefficiencies and environmental burdens are also showing up. In this case, the night sky records a byproduct of fossil fuel production that has economic, climate, and policy implications.
Brightening and dimming tell different stories
The maps also point to a more complicated global picture than a simple growth narrative. NASA said factors including rural electrification and energy conservation are changing how billions of people experience the night. Brightening can signal expanded access to electricity, growing settlement, or industrial buildout. Dimming can indicate improved efficiency, reduced waste, or stress and disruption, depending on the local context.
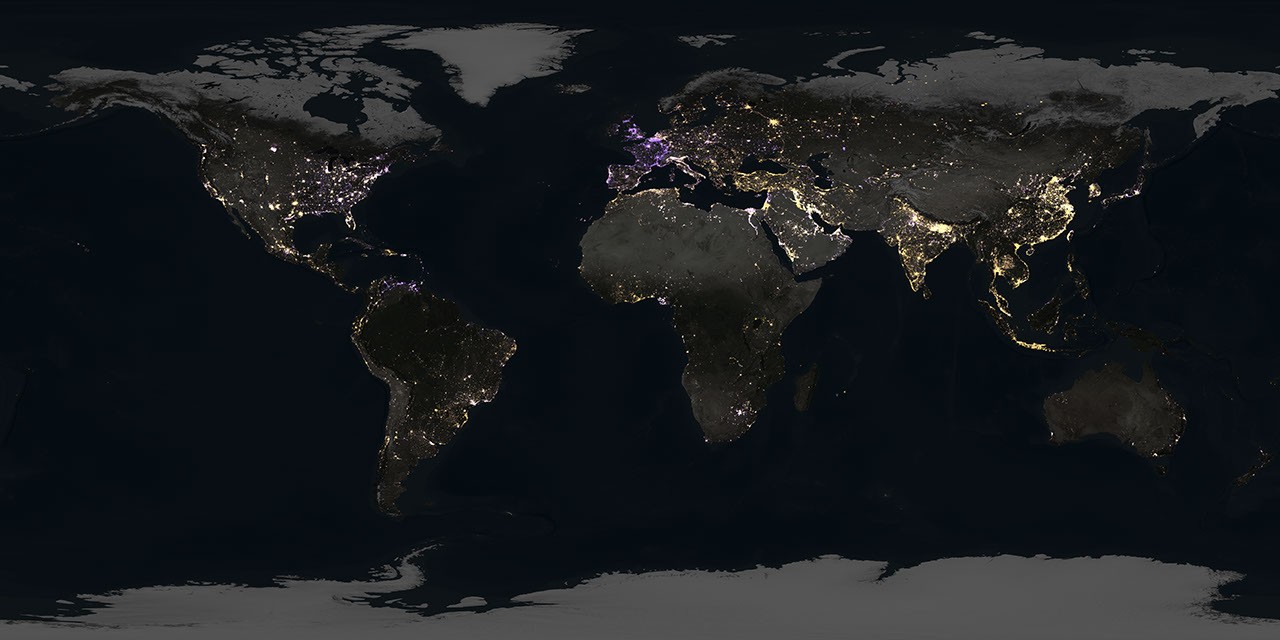
What makes the new product notable is its ability to capture both directions over time and present them as part of the same planetary system. Golden areas in the visualization indicate brightening. Purple areas indicate dimming. White areas show places that experienced both types of change over the period. That means the map is less a static image than a record of volatility.
Miguel Román, deputy director for atmospheres and data systems at NASA’s Goddard Space Flight Center, said the work shows one way NASA data is advancing national security interests at a critical time. His comment hints at another dimension of the study. If night-light change can reveal energy shifts, infrastructure strain, or patterns of instability, it can inform not just climate and development analysis but strategic assessment as well.
Why this changes how Earth observation can be used
The broader importance of the project lies in what it suggests about satellite observation as a tool for understanding human systems. Nighttime light is visible, but the forces behind it span economics, policy, technology, environment, and geopolitics. A decade-scale record of change creates opportunities to compare oil field activity, urban growth, conservation efforts, and rural access in ways that are difficult to replicate with fragmented local data.
It also shows how Earth observation can illuminate ordinary infrastructure decisions as well as exceptional events. Energy transition is often discussed in terms of laws, investments, and emissions targets. This study adds another layer: it shows that transition leaves a visible signal in the night itself.
The maps do not provide a single verdict on whether the world is getting brighter or darker. Instead, they show a planet flickering with uneven change. That may be the most important finding. The global energy and development story is not moving in one direction at one speed. It is becoming more fragmented, more dynamic, and more legible from orbit.
This article is based on reporting by science.nasa.gov. Read the original article.
Originally published on science.nasa.gov